Application Insights Setup Guide
This guide shows how to wire Engram to Azure Monitor / Application Insights and view useful dashboards.
1) Prerequisites
- Application Insights / Log Analytics workspace (already provisioned via
infra/main.bicepas<env>-logs). - Connection string available as env
APPLICATIONINSIGHTS_CONNECTION_STRING(pass via Key Vault or pipeline). - Backend already includes OpenTelemetry + Azure Monitor exporter.
2) Configure env vars (backend + worker)
Add to your deployment settings / Key Vault:
APPLICATIONINSIGHTS_CONNECTION_STRING=<your-connection-string>- Optional sampling:
OTEL_TRACES_SAMPLER=parentbased_always_on(ortraceidratiowithOTEL_TRACES_SAMPLER_ARG=0.25for 25%).
3) Verify signals emitted
- Traces: request spans (
/api/v1/*), Temporal activity spans, LangGraph calls. - Metrics: standard App Service/Container Apps + OTEL process metrics if enabled.
- Logs: structured JSON logs from backend (via
backend/observability/logging.py).
4) Useful Kusto queries
Latency p95 by route
requests
| summarize p95(duration) by name
| order by p95_duration desc
Error rate by route
requests
| summarize errors = countif(success == false), total = count() by name
| extend error_rate = todouble(errors)/todouble(total)
| order by error_rate desc
VoiceLive WebSocket failures
traces
| where message has "VoiceLive WebSocket" and severityLevel >= 3
| project timestamp, message, customDimensions
| order by timestamp desc
Temporal activity failures
traces
| where message has "Temporal" and message has "failed"
| project timestamp, message, customDimensions
5) Dashboards to create
- API Overview: request count, p95 latency, error %, top failing routes.
- VoiceLive: WebSocket connect errors, STT/stream errors, avg call duration.
- Temporal: workflow starts/completions, activity failure count, queue latency (use custom metrics once emitted).
- Memory/Zep: count of enrichment calls, latency, failures (add custom events when you instrument memory client).
Evidence & Telemetry dashboard (example)
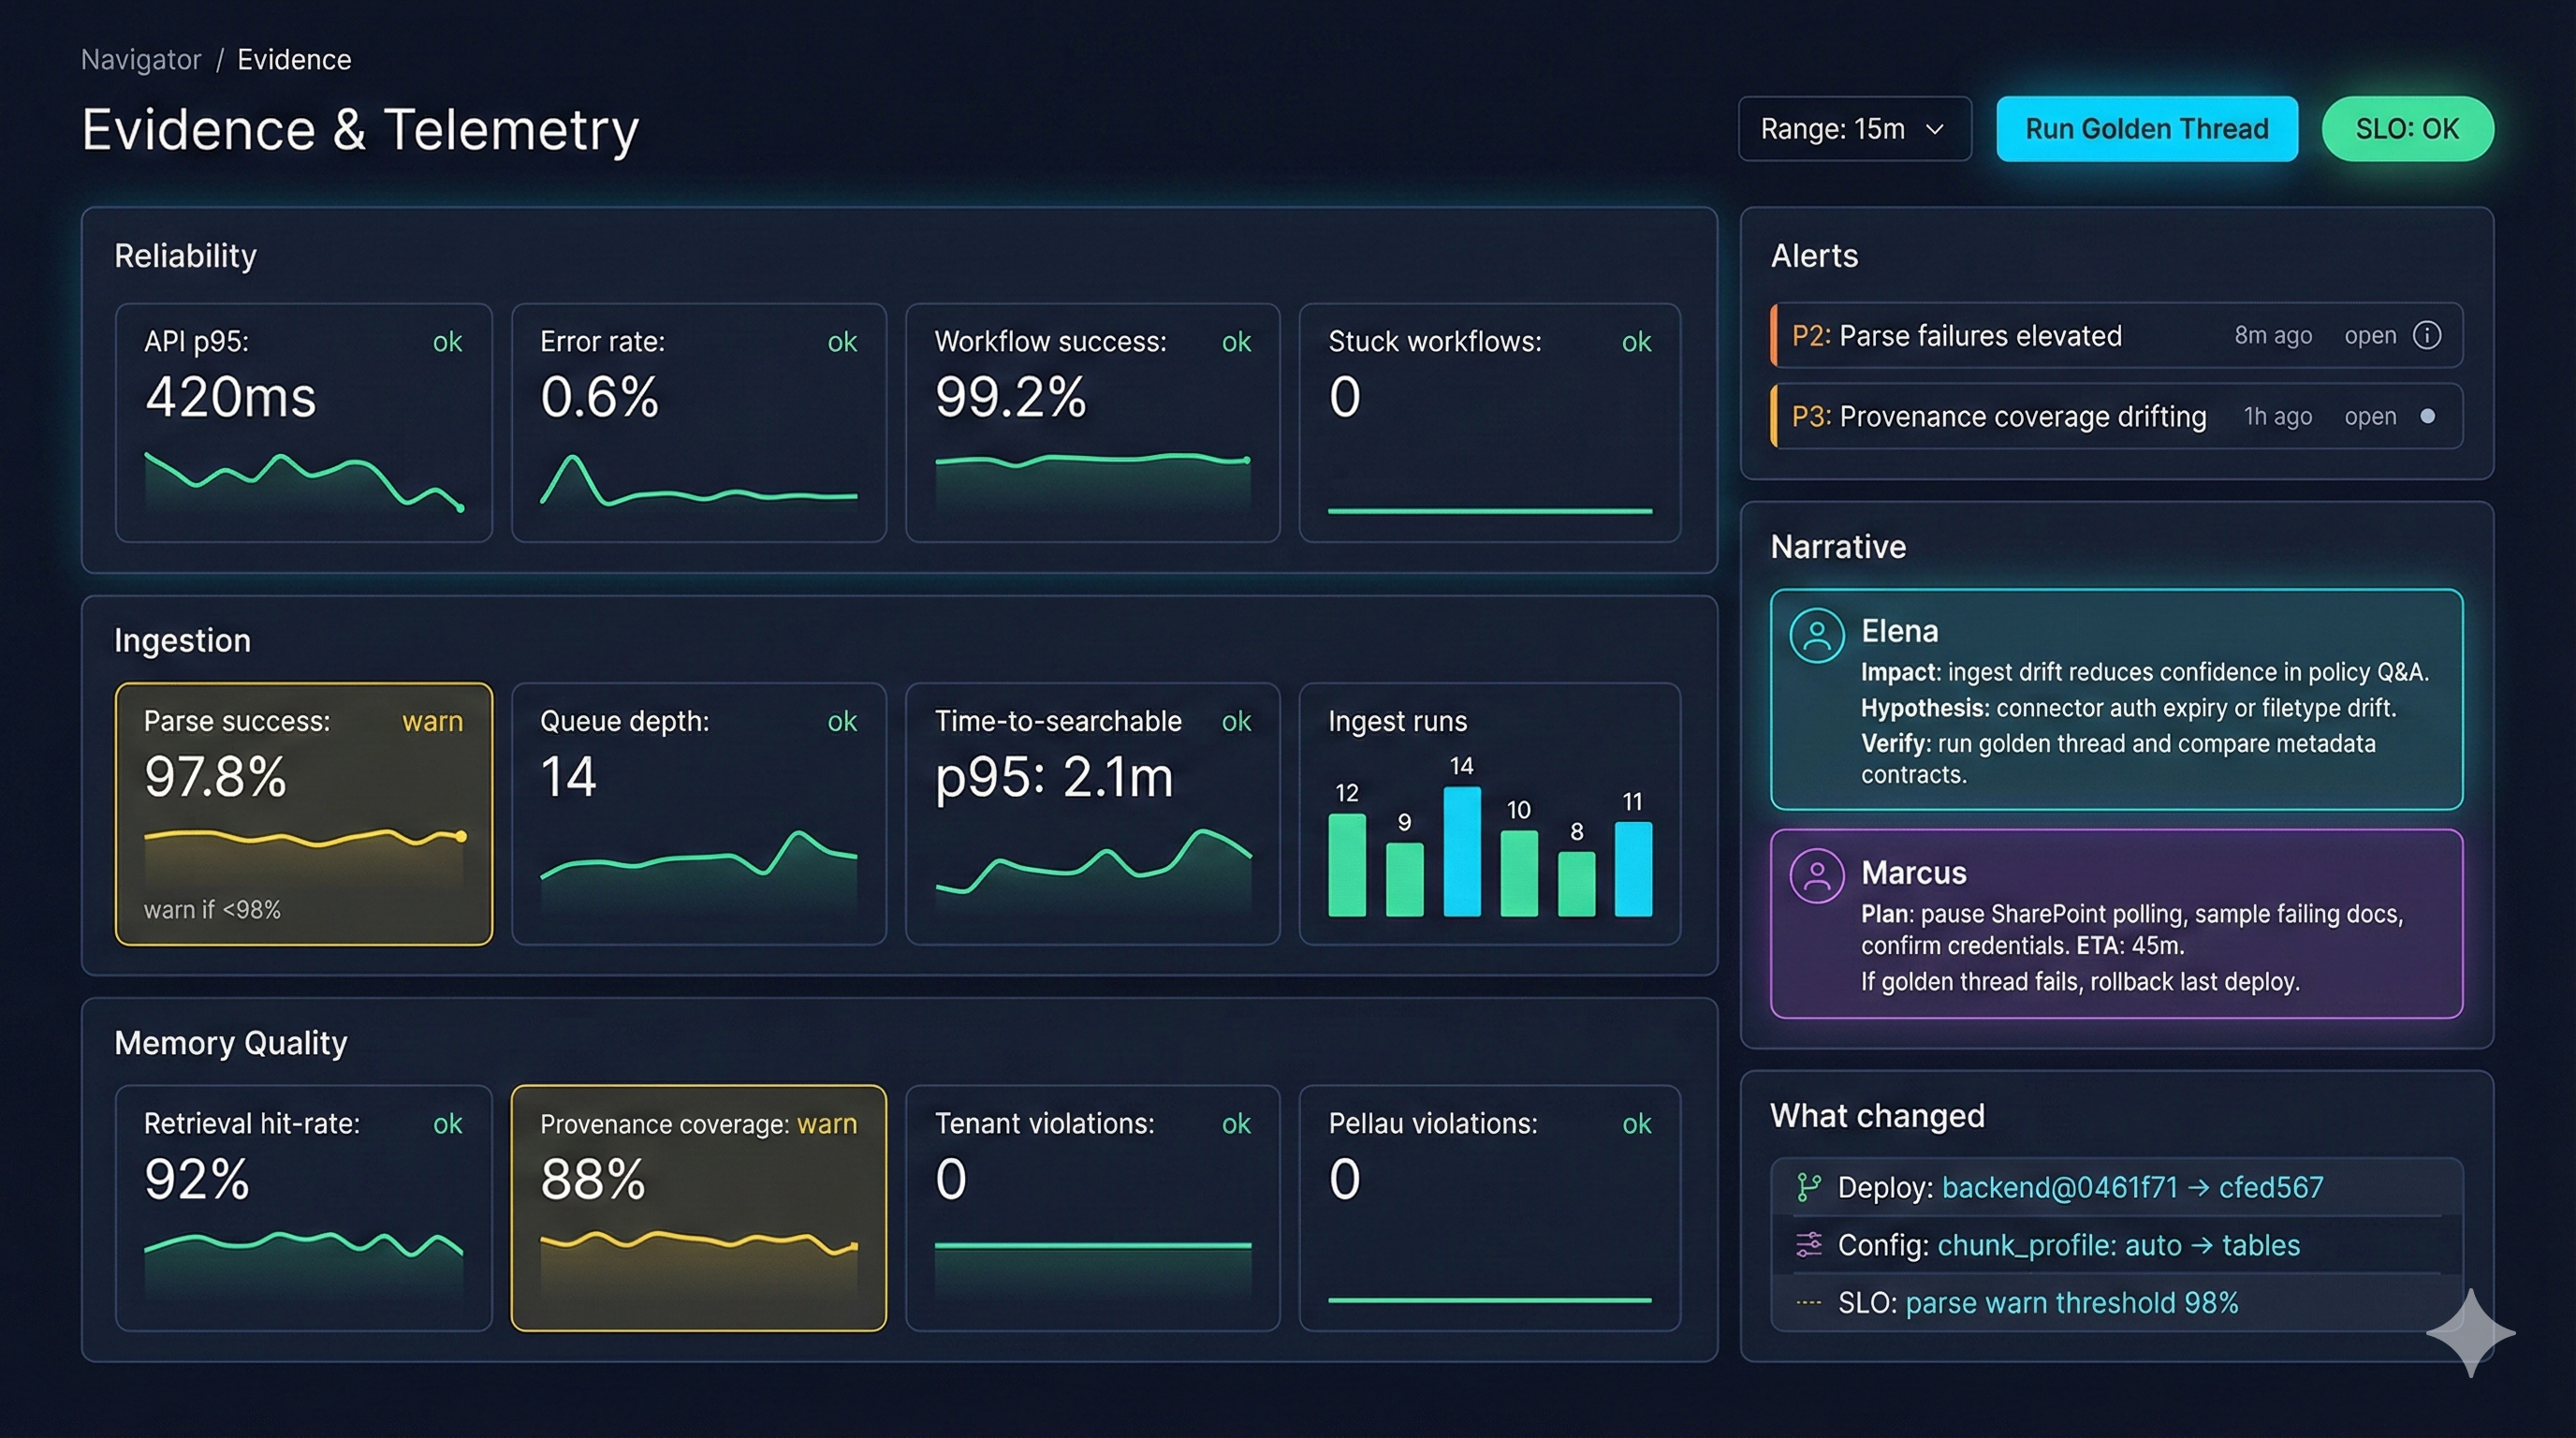
- Reliability tiles: API p95, error rate, workflow success, stuck workflows.
- Ingestion tiles: parse success, queue depth, time-to-searchable, ingest run counts.
- Memory quality: retrieval hit-rate, provenance coverage; use this to tune connector ACL propagation.
- Alerts + narrative: pairs P2/P3 alerts with hypotheses and verification steps for on-call.
- “What changed” summarizes deploy commits, config flips, and SLO threshold updates for fast blame/verify.
6) Optional: custom spans/metrics to add
- Wrap VoiceLive session create/send_audio with spans (
opentelemetry.trace.get_tracer(__name__)). - Emit counters for
memory_enrich_success,memory_enrich_failure,zep_search_latency_ms. - Emit Temporal activity metrics:
activity_name,attempt,latency_ms,success.
7) Local test
export APPLICATIONINSIGHTS_CONNECTION_STRING="InstrumentationKey=...;IngestionEndpoint=...;LiveEndpoint=..."
PYTHONPATH=. uvicorn backend.api.main:app --host 0.0.0.0 --port 8082
Generate traffic, then check the App Insights workspace → Logs.
8) CI/CD reminder
- Ensure
APPLICATIONINSIGHTS_CONNECTION_STRINGis set as a secret and mapped into the backend/worker Container Apps env. - For production, prefer sampling (traceidratio 10–25%) to control cost.